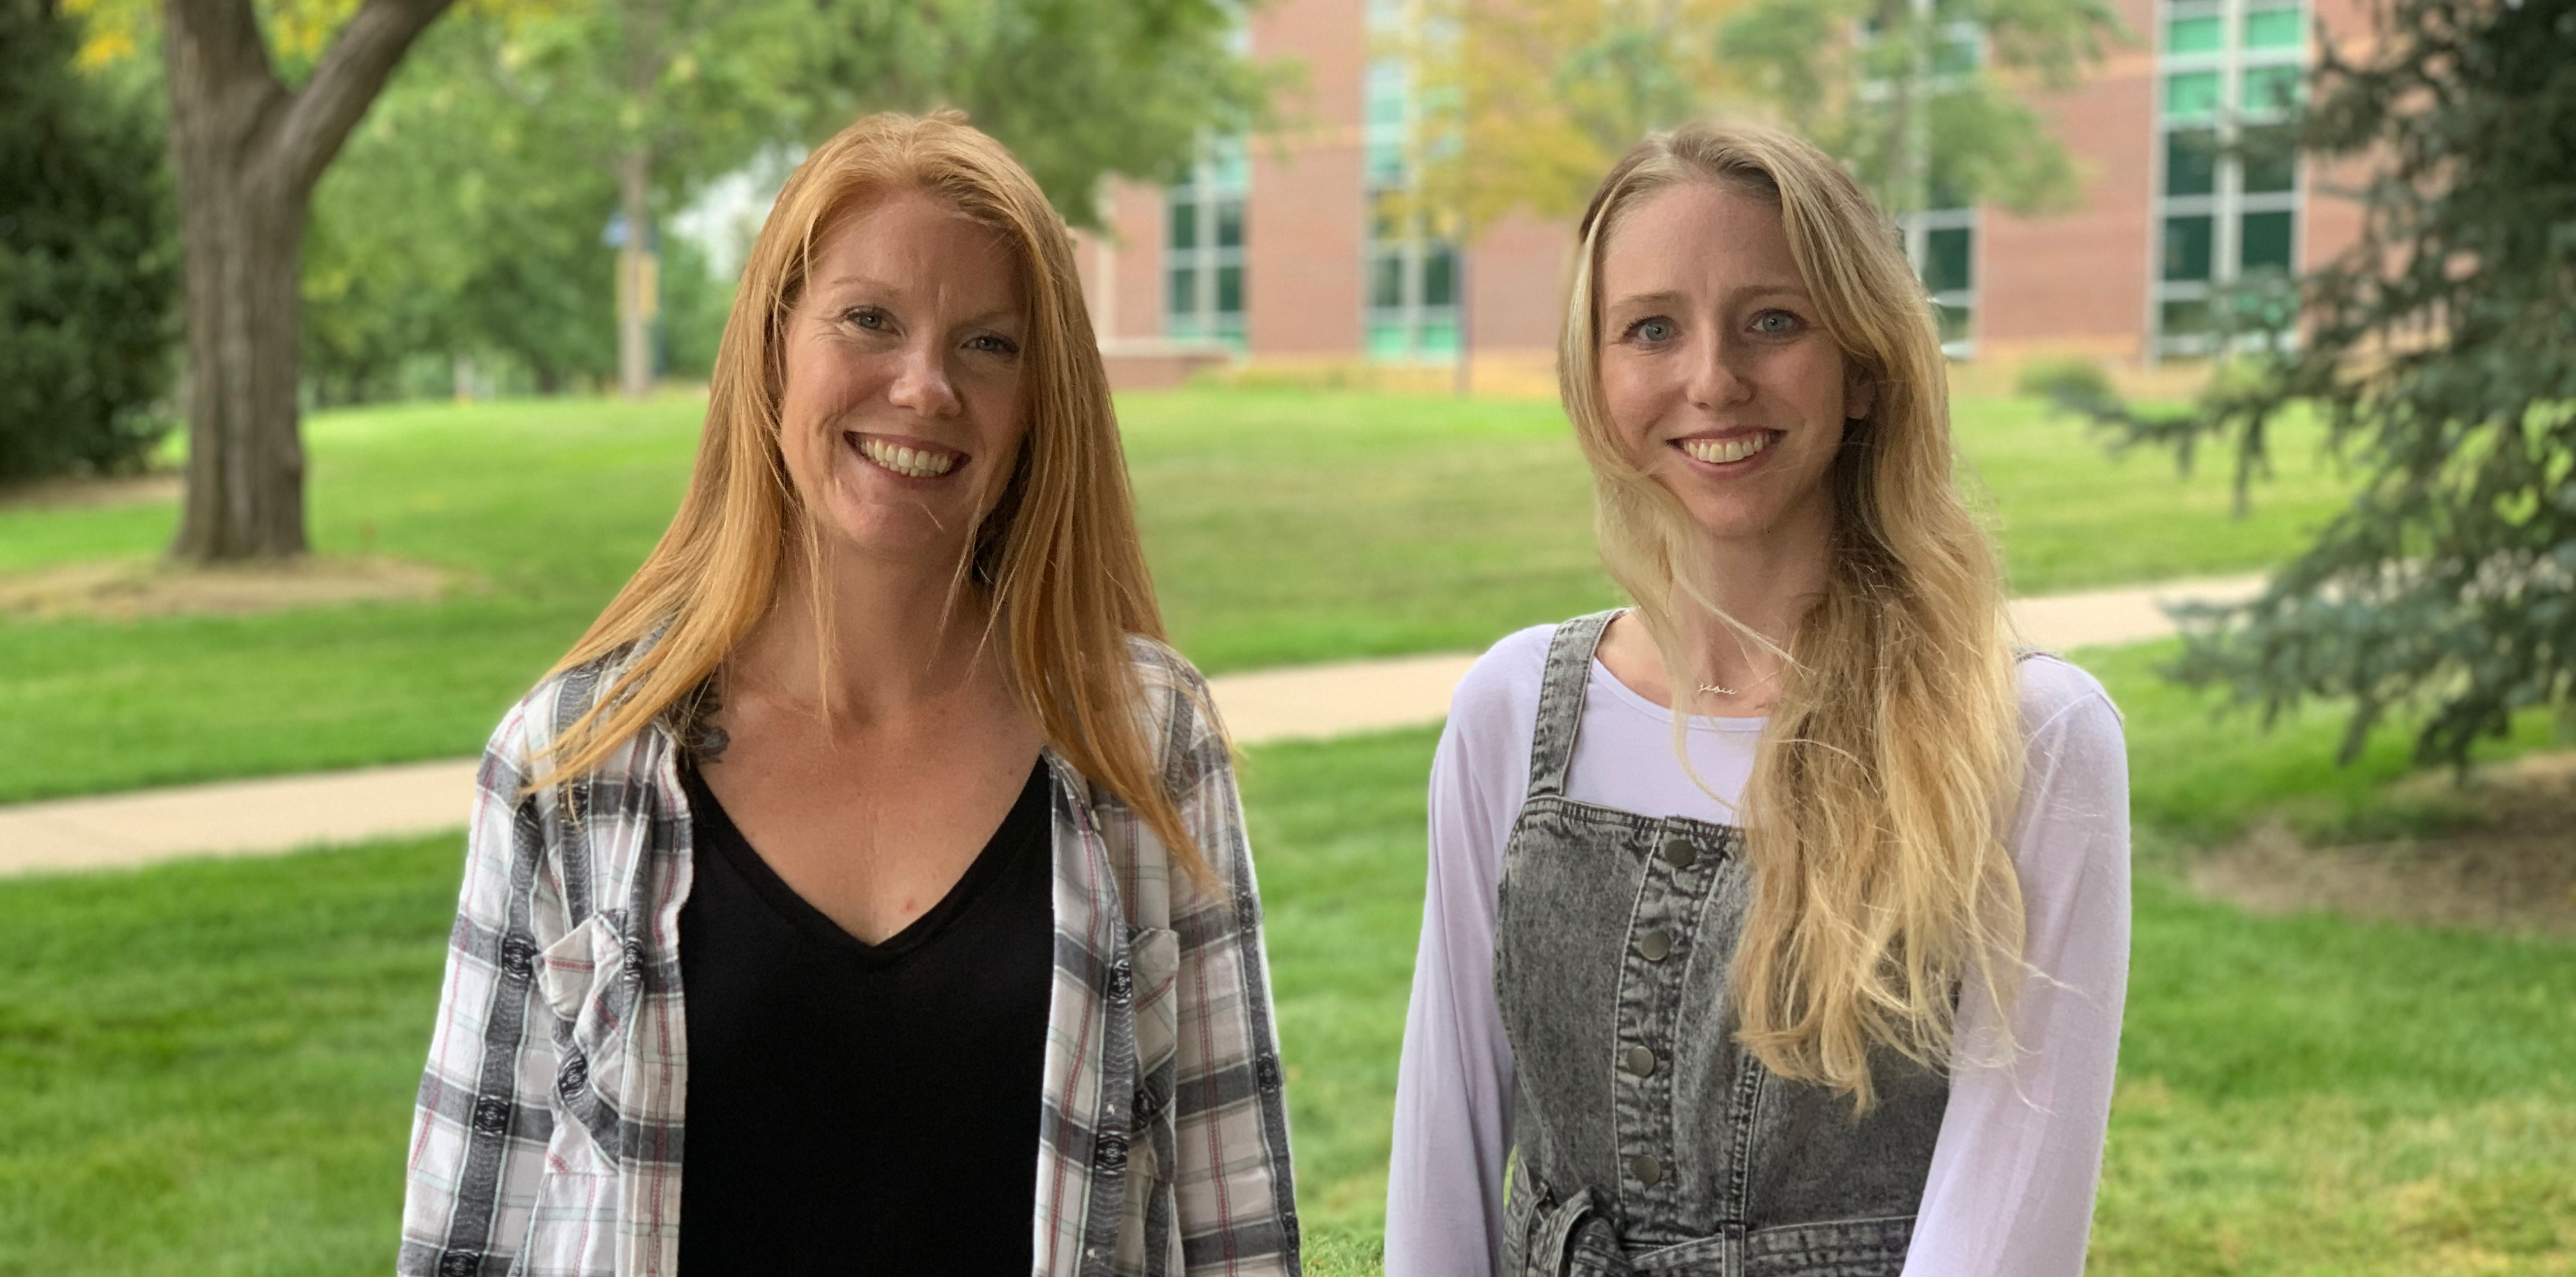
Hi, I’m Katie Corder, the creative content producer at the University of Northern
Colorado. I sat down with Jieun Lee, who is an assistant professor of geography and
geographic information systems, or GIS, at UNC, as well as Ivan Ramírez, a geography
and environmental sciences instructor at the University of Colorado, Denver, to discuss
their published research on studying the 1998 El Niño event in northern, coastal Peru
and its influence on the spread of seven diseases.
The year and location are very important for their maps since Peru is considered ground
zero for El Niño, and 1998 was one of the strongest El Niño years observed. By using
GIS techniques, they were able to better understand the high and low levels of these
spreading diseases in Peru. Their findings can assist Peruvian public health officials
and those in disaster management and response to better intervene and prepare for
risk of disease spread in future El Niño events.
In this podcast, Dr. Lee and Dr. Ramírez go into more detail about the importance
of using GIS to map disease spread during El Niño in Peru, how they conducted their
research and how GIS can be used to give further insights into different disciplines,
such as crime mapping.
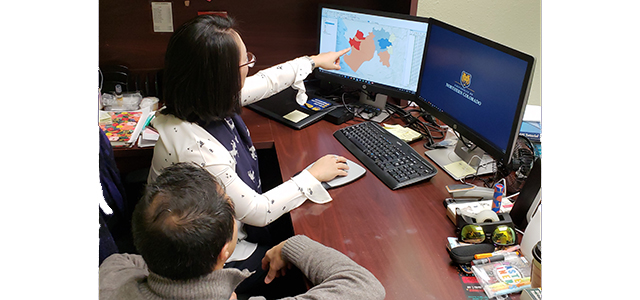
Lee: We studied how El Niño, an unusual weather event in Peru, South America, affects
the local environment and public health. Particularly tried to understand how many
infections and how these infections concentrate in places using cool maps. Because
everything happens in a place, and if we know the location of it, you can map it!
Could you describe your research on mapping the multi-disease risk during El Niño,
and what do you mean by “multi-disease risk?”
Ramírez: We refer to this type of public health phenomena or problem as “ecosyndemic.” Basically,
what we did was examine seven water-related diseases in northern, coastal Peru in
a place called Piura. In early 1998, and 1998 is very important because there was
a very strong El Niño, or climatic event, that occurred then, and what we did was
explore two ways, or two methodologies, that we can map such phenomena.
Multi-disease just means rather than focusing on one disease, we’re starting now to
look at interactions between diseases, and, as geographers, we’re looking at more
in the context of place.
“Ecosyndemic”: Can you break that apart for us?
Ramírez: If your immune system is weakened, then you’re more susceptible to other infections.
The concept was actually developed so that you could look at these disease interactions,
which have some biological grounding, but also, the fact that they might be also embedded
within a wider social context: why are people exposed? Why are certain people exposed?
Why is it spreading within certain populations? It has this strong social context.
We kind of touched on that in the study but we were interested in looking at ‘Well,
what are the geographic boundaries of syndemics, and how are they manifested when
it comes to the context of environmental change?’
The types of diseases that were looked at?
Ramírez: What’s interesting about all of these is they’re water-related, so they all have
some kind of water connection. We looked at cholera, we looked at two types of malaria,
conjunctivitis, we looked at other diarrheal diseases that weren’t cholera, pneumonia
as well as other respiratory diseases that weren’t pneumonia, so it was a set of seven
diseases.
Can you describe how you mapped the multi-disease risk, and what software/program
and techniques?
Lee: To map the multi-disease risk we used ArcGIS, GIS is software, GIS here is short
for geographic information systems that was developed and is now widely used to capture,
store, manipulate, analyze and manage geospatial and geographic data. So, when we
organized the data for disease for this study and other factors with locational information,
then we can then easily create maps that show spatial patterns to see if there are
spatial clusters, there are concentrating in certain areas, or how widely the patterns
are dispersed. Then, we can explore the potential links or relationships between the
spatial patterns and other contextual factors, such as vulnerability of the population,
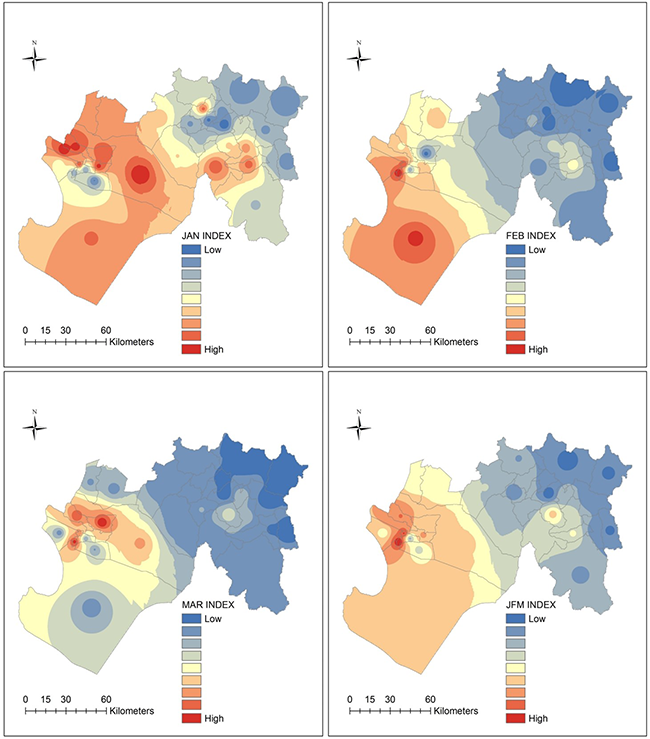
environmental elements, even the extreme events. In this research, besides the individual
disease incidents maps, so an individual map represents an individual disease, we
also used IDW, which is Inverse Distance Weighing and tabulation techniques to create
a smooth surface. For the multi-disease risk using this index, we created a composite
index. Another GIS technique we incorporate in this research was hot-spot analysis,
which uses a statistical treatment to detect where spatial clusters of high value,
which means hot spot or great concentration, or low value with the other side of the
value that other concentrates occurred.
Can you explain in non-technical terms how an El Niño event occurs, and what’s to
be expected when an El Niño is predicted?
Ramírez: Cold water in the east rises to the surface, it gets pulled to the surface and gets
pulled by the winds towards the west, and you have a pile up of warm water, and when
it’s exposed to the sun it gets warm. And with that warm water moving towards the
west, you got moisture moving in that direction, too, and you have drier conditions
off the coast of western South America. Once an El Niño starts developing, what we
might tend to see is that the winds weaken. And if we say the winds are weakening,
then those winds aren’t pulling the currents anymore towards the west, and this occurs
over several months. Once those waters are not being pulled towards the west anymore,
they start to shift back. Once they start shifting back, it’s really this warm mass
of water that starts moving towards South America, and when those warm waters hit
the coast of South America, the surface temperature at the ocean rise, and so, El
Niño then with this warm water invasion disrupts this cold water. Basically, the Pacific
Ocean is pretty big … it’s basically the atmosphere and the ocean, or the air and
the sea, interacting with one another, speaking to one another, influencing one another,
and these large-scale changes across the Pacific are now linked to other weather patterns
around the planet. Of course, most immediate are along the Equator, but it goes beyond
that, as well. And those changes, locally and regionally and globally, impact disease
pathogens, and they impact what kind of weather or climate-related hazards we might
experience: floods and droughts are the simplest ones to think about.
Can you describe how this research is influential to future research and/or policy
planning? How would someone who makes policies and is trying to rectify these issues?
Ramírez: Right now, we have an El Niño event that’s been forecasted. It means that it should
be developing this spring. If we can find ways to visualize multiple diseases, but
even then, moving further to looking at disease and social problems today, and find
out where might be the best place to target interventions where you might have greater
concentrations of more diseases than usual. It can help public health authorities.
I think it might also provide some insight to those who are looking at disaster management
and development, as well, as indicators of vulnerability in these places at certain
times. GIS enables you to visualize these patterns of change and when you’re better
identifying or locating you can have a more precise location in place, that also depends
on the data. The index that we created, can also tell us what communities are most
sensitive, so if we look at vulnerability we might also look at which communities
are most sensitive to these extreme events and when, which would enable public health
authorities to act.
Can you describe how geography and GIS are connected to other sciences, such as in
this research?
Lee: Geography, by all means, is very interdisciplinary and complimentary to other disciplines
in sciences by bringing special perspectives. And investigating the relationship between
specific phenomena and a special context that creates really the wholesome big picture.
Things that happened around us have locational elements. They’re happening somewhere,
then we can use the information about the location to create a map. Specifically,
GIS takes a role in effectively visualizing where things happen and understanding
why they happen in the specific places and time, if the data allows. For example,
I teach a course here at UNC that’s crime mapping that introduces GIS applications
to our students to identify spatial patterns of criminal activities and explore related
environmental factors to certain activities.
I think those are all the questions I have! Thank you so much for speaking to me,
and congrats on the publication.