
A number of organizations are producing interactive maps to help people visualize real-time data on coronavirus (COVID-19) cases, and to help track those cases to show the bigger picture of the pandemic.
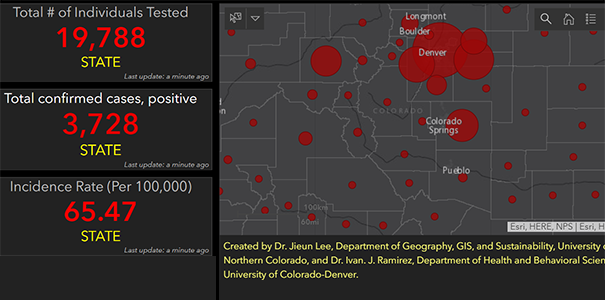
Top image: Screenshot of Jieun Lee's interactive map of positive COVID-19 cases in Colorado.
Major interactive maps that are continuously updated include:
- World Health Organization’s Novel COVID-19 situation dashboard
- Johns Hopkins Center for Systems Science and Engineering’s Global Cases dashboard
- United Nations dashboard that focuses on Italy but also displays the outbreak at a global level
ArcGIS Online Operations Dashboard, a web-application-based software, uses these interactive maps, as well as charts, gauges and more, to help equip emergency response agencies and personnel with real-time, powerful data visualizations.
 “Mapping the COVID-19 outbreak gives key clues in understanding the current pattern,
predicting the potential disease spread and mitigating the impacts in communities
with a better understanding of vulnerability and resilience,” said Jieun Lee, Ph.D., an assistant professor in the UNC department of Geography, GIS, and Sustainability.
“Mapping the COVID-19 outbreak gives key clues in understanding the current pattern,
predicting the potential disease spread and mitigating the impacts in communities
with a better understanding of vulnerability and resilience,” said Jieun Lee, Ph.D., an assistant professor in the UNC department of Geography, GIS, and Sustainability.
Lee has created her own interactive map called, "Colorado Coronavirus COVID-19 Cases Dashboard By University of Northern Colorado Department of Geography, GIS, and Sustainability" that tracks confirmed cases of COVID-19 in Colorado:
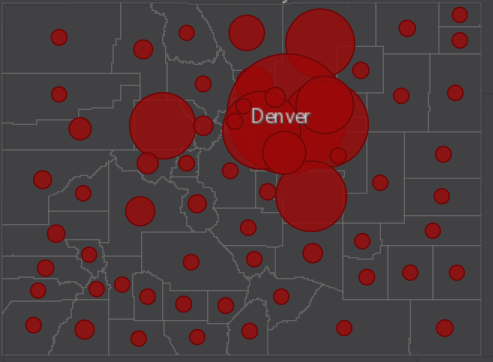
Above: Screenshot of Lee's interactive map of positive COVID-19 cases in Colorado.
Since this type of disease mapping uses publicly available data, it carries the limitations of data accuracy due to privacy as well as cases not yet confirmed. However, in terms of predicting the virus’ spread, the level of social and health vulnerability for Colorado communities, specifically, can be explored to help officials and residents better prepare.
“In order to respond to the outbreak ahead of reaching its peak in Colorado, it’s crucial to understand what preexisting conditions make a certain community more vulnerable to the pandemic as well as the resources communities need to recover,” Lee said. “Such exploration of vulnerability and resilience must be through a spatial lens.”
This can be accomplished by using GIS software to better visualize and map out those communities. At its current stage in the U.S., COVID-19 incidence data are available at a county-level view. Including high-definition mapping that also uses data at a finer geographical scale can also enhance mapping the disease, such as including census tract data.
Last year, Lee and Ivan Ramirez, a visiting professor at the University of Colorado, used GIS mapping to track hot spots of diseases in Piura, Peru, related to El Niño weather patterns. She explains that “GIS enables us to organize, present and analyze spatial and geographic data to identify the current hot spots/epicenter as well as predict its spread over space, or the spatial diffusion.”
—Written by Katie Corder
More Stories
-

Alumna Receives NSF Graduate Fellowship for Avian Conservation Research
Este artículo no está en español.
-

Novel and Interdisciplinary Research on Transgender Health
Este artículo no está en español.
-

Grad Students Researching Methods to Strengthen Mental Health Training in Rural Schools
Este artículo no está en español.
-

Doctoral Students Present Dissertation Projects in Three-Minute Competition
Este artículo no está en español.