
UNC Budget Data
- Net revenue and expenditure FY13-FY20
FY13
FY14
FY15
FY16
FY17
FY18
FY19 Preliminary
FY20 Budget
Undergraduate Tuition & Fee Revenue (NTR)
UG Gross Revenue
$82.4
$81.2
$83.2
$86.4
$95.4
$101.2
$102.7
$101.7
UG Discounting
(15.2)
(15.3)
(16.6)
(18.6)
(23.4)
(30.3)
(28.3)
(29.4)
UG Net Revenue
$67.2
$65.9
$66.6
$67.9
$71.9
$70.9
$74.4
$72.3
Graduate Net Tuition & Fee Revenue (NTR)
GR Gross Revenue
25.5
26.4
26.6
28.2
32.2
34.4
33.7
33.6
GR Discounting
(4.0)
(4.0)
(4.3)
(4.7)
(5.4)
(5.9)
(5.6)
(5.2)
GR Net Revenue
$21.5
$22.5
$22.2
$23.5
$26.8
$28.5
$28.1
$28.4
Net Tuition Revenue
$88.7
$88.3
$88.8
$91.4
$98.7
$99.4
$102.5
$100.7
Room & Board Net
$31.0
$29.6
$29.8
$30.7
$32.2
$33.0
$31.5
$30.7
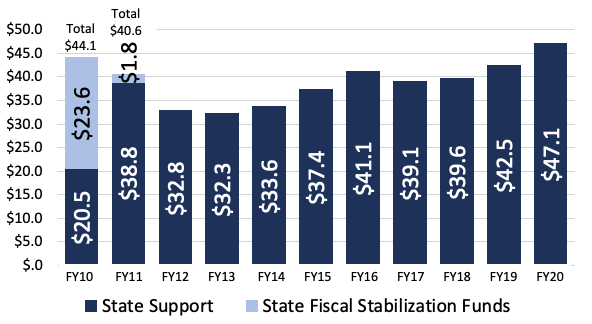
State Funding
$32.3
$33.6
$37.4
$41.1
$39.1
$39.6
$42.5
$47.1
All Other Revenue
$22.9
$23.5
$23.5
$22.4
$22.9
$27.6
$25.9
$23.6
Annual Net Revenue
$174.9
$175.0
$179.5
$185.6
$192.9
$199.6
$202.4
$202.1
Faculty Salaries
$39.3
$41.8
$43.0
$43.6
$44.9
$47.2
$47.5
$47.3
All Other Salaries
51.0
53.8
55.6
56.6
60.5
61.9
60.8
60.3
Benefits
22.8
24.9
26.5
27.8
29.4
30.7
30.6
30.9
Operating Expenses
42.6
44.2
45.3
44.3
47.0
47.5
46.6
48.0
Debt Service
11.0
10.4
11.8
10.9
12.0
12.0
11.0
11.6
Capital (Cash & Donor)
9.4
10.3
10.9
9.1
4.3
8.4
6.8
5.9
Annual Expenditures
$176.1
$185.4
$193.1
$192.3
$198.1
$207.8
$203.3
$204.0
Cash Surplus / (Deficit)
($1.2)
($10.4)
($13.6)
($6.7)
($5.2)
($8.2)
($0.9)
($1.9)
- State funding trend FY13-FY20
- Resident undergraduate cost of attendance FY13-FY20
Tuition and Fees
FY13
FY14
FY15
FY16
FY17
FY18
FY19
FY20
$ Increase
/(decrease) FY13 to FY20
% Increase
/(decrease) FY13 to FY20
Tuition (student share)
$ 5,464
$ 5,748
$ 6,024
$ 6,372
$ 6,906
$ 7,374
$ 7,596
$ 7,596
$ 2,132
39.0%
Student Activity Fees
990
1,027
814
837
862
888
915
942
(48)
-4.8%
LEAF
20
20
20
20
20
20
20
20
-
0.0%
Technology Fee
285
285
295
303
312
322
331
341
56
19.6%
Library Fee
78
88
130
134
138
142
146
150
72
92.3%
Capital Fee
-
-
450
500
650
800
910
937
487
108.2%
Subtotal Tuition and Fees
$ 6,837
$ 7,168
$ 7,733
$ 8,166
$ 8,888
$ 9,546
$ 9,918
$ 9,986
$ 3,149
46.1%
Typical Room & Board
10,488
10,490
10,560
10,560
10,770
10,980
11,204
11,204
716
6.8%
Total Cost of Attendance*
$ 17,325
$ 17,658
$ 18,293
$ 18,726
$ 19,658
$ 20,526
$ 21,122
$ 21,190
$ 3,865
22.3%
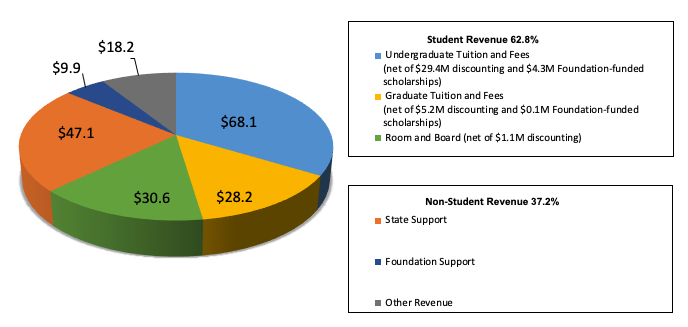
- FY20 operating revenue
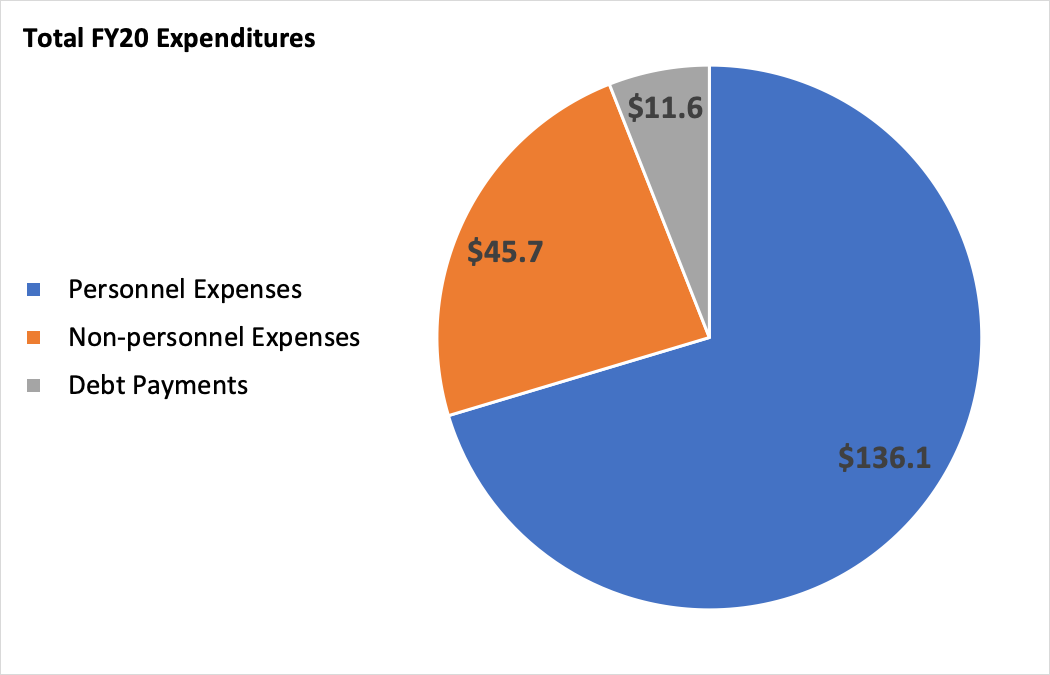
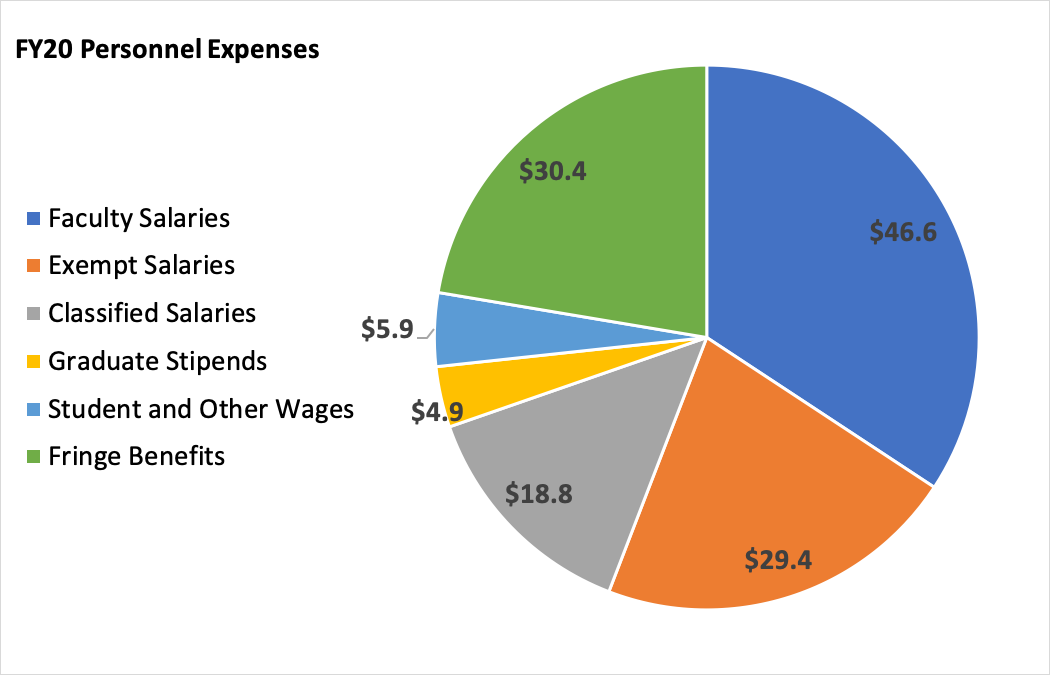
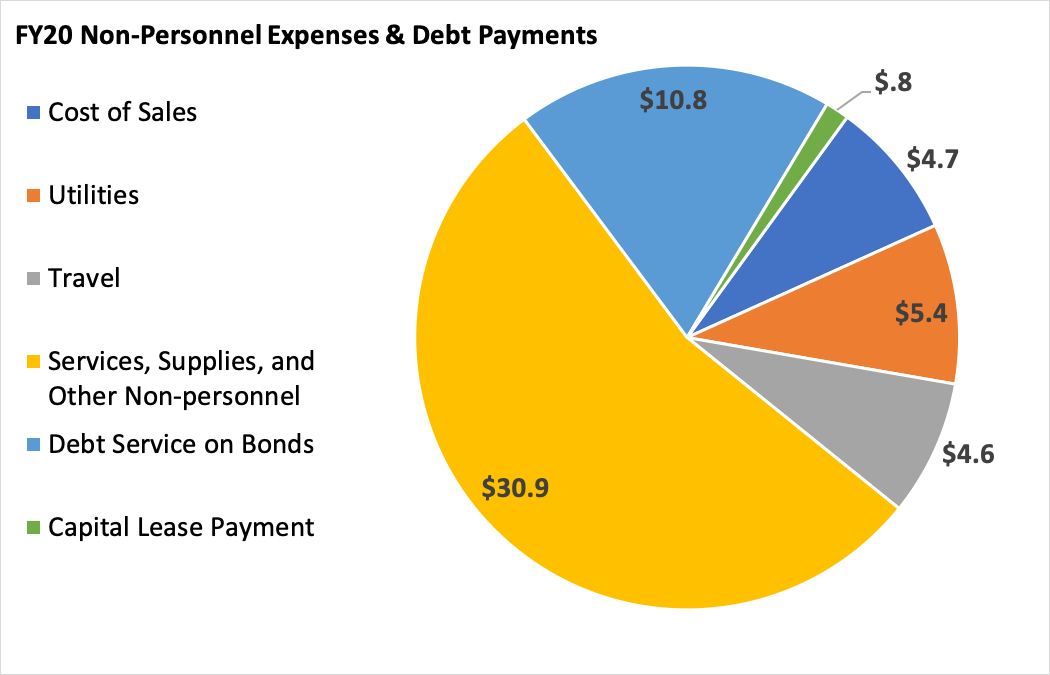
- FY20 expenditures
- FY20 foundation support
FY19 Forecast
FY20 Budget
FY20 Changes
Restricted Program Support
Athletics
$ 727,035
$ 482,125
$ (244,910)
Provost
5,000
5,200
200
Library
284,423
359,860
75,437
EBS
322,421
308,040
(14,381)
HSS
332,144
243,533
(88,611)
MCB
1,032,338
1,207,138
174,800
NHS
144,360
128,170
(16,190)
PVA
459,435
165,364
(294,071)
Stryker Institute
261,564
275,876
14,312
Tointon Institute
204,170
228,425
24,255
Other
126,388
98,215
(28,173)
Total Restricted Program Support
$ 3,899,278
$ 3,501,946
$ (397,332)
Scholarships
Institutional Scholarship Support
$ 1,607,000
$ 1,607,000
$ -
Restricted Scholarships
Named and Endowed Scholarships
3,863,279
3,750,000
(113,279)
Athletics Scholarships
326,604
425,000
98,396
Greeley Promise & Other Scholarships
216,000
216,000
-
Total Scholarship Support
$ 6,012,883
$ 5,998,000
$ (14,883)
Capital Support
Campus Commons
$ 1,167,738
$ 361,000
$ (806,738)
NHS
60,295
-
(60,295)
PVA Pianos
614,000
-
(614,000)
PVA Gray Hall
20,000
-
(20,000)
Jaccaud Garage Renovation
41,000
-
(41,000)
MCB Kepner 0060 Renovation
55,814
-
(55,814)
Total Capital Support
$ 1,958,847
$ 361,000
$ (1,597,847)
Grants
MCB Daniels Fund Ethics
$ 258,446
$ 266,000
$ 7,554
Frontiers of Science
126,653
124,000
(2,653)
Healthy Schools Professional Development System
326,772
-
(326,772)
Grants under $100,000
13,095
314,000
300,905
Total Grants Support
$ 724,966
$ 704,000
$ (20,966)
Total Foundation Support
$ 12,595,974
$ 10,564,946
$ (2,031,028)
Reflects the budget for funds that will be transferred to UNC and used in the current year. Does not reflect funds raised.
- FY20 restricted grants and contracts
Federal Grants
Project Climb
396,000
UNC SSS (Student Support Services) TRIO
304,000
Upward Bound TRIO
248,000
McNair TRIO
209,000
Project TREE (Training Rural Early Educators)
167,000
Teaching Excellence & Achievement (TEA) IREX
149,000
(International Research & Exchanges Board)
CO STEM Noyce Scholarship Program
119,000
Preparation for Interpreters
116,000
Bridging Blindness & Behavior
114,000
Under $100,000
2,499,000
Subtotal Federal Grants
4,321,000
State Grants
UNC Center for Rural Education
335,000
Under $100,000
405,000
Subtotal State Grants
740,000
Non-Governmental Grants
Improving Classroom Culture
203,000
Under $100,000
855,000
Subtotal Non-Governmental Grants
1,058,000
Non-Governmental Grants - UNC Foundation
MCB Daniels Fund Ethics
266,000
Frontiers of Science Grant
124,000
Under $100,000
314,000
Subtotal UNC Foundation Grants
704,000
Total Restricted Grants & Contracts
6,823,000